time spent on CPE430, Spring 2016
Earlier this year, I was talking to Kurt Mammen, who’s teaching 357, and he mentioned that he’d surveyed his students to see how much time they were putting into the course. I think that’s an excellent idea, so I did it too.
Specifically, I conducted a quick end-of-course survey in CPE 430, asking students to estimate the number of weekly hours they spent on the class, outside of lab and lecture.
Here are some pictures of the results. For students that specified a range, I simply took the mean of the endpoints of the range as their response.
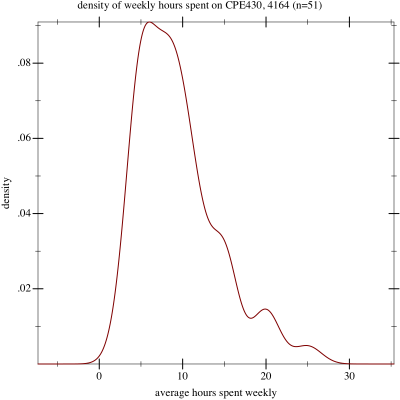
Density of responses
Then, for those who will complain that a simple histogram is easier to read, a simple histogram of rounded-to-the-nearest-hour responses:
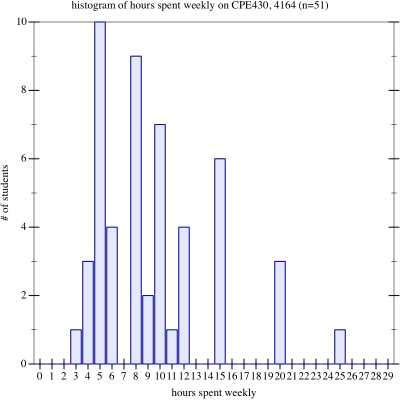
Histogram of responses
Finally, in an attempt to squish the results into something more accurately describable as a parameterizable normal curve, I plotted the density of the natural log of the responses. Here it is:
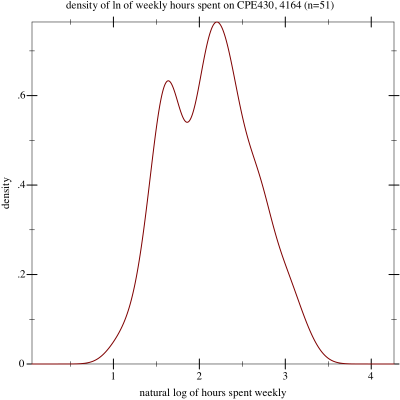
Density of logs of responses
Sure enough, it looks much more normal, with no fat tail to the right. This may just be data hacking, of course. For what it’s worth, the mean of this curve is 2.13, with a standard deviation of 0.49.
(All graphs generated with Racket.)